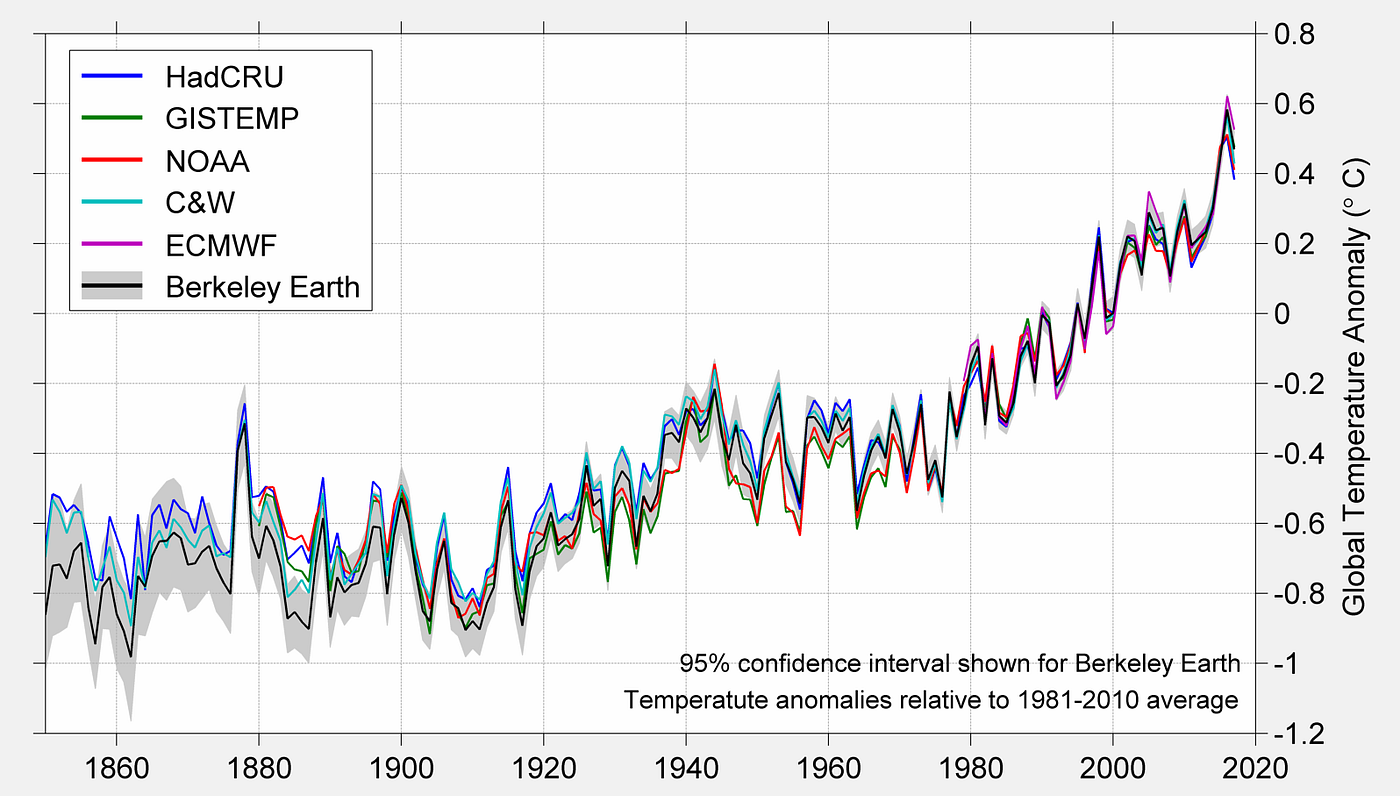
Time series data, which comprises observations collected over sequential time intervals, is ubiquitous in various fields like finance, economics, climate science, and more. Analyzing this type of data can reveal crucial insights and help in making informed decisions. In this guide, we will delve into essential techniques for time series analysis, allowing you to extract meaningful patterns and trends from your temporal datasets.
1. Understanding Time Series Data
a. Defining Time Series: An introduction to time series data and its prevalence in different domains.
b. Characteristics of Time Series Data: Exploring the unique features and properties that distinguish time series from other types of data.
2. Trend Identification in Time Series
a. Moving Averages: Understanding how moving averages smooth out noise to reveal underlying trends.
b. Exponential Smoothing: Exploring techniques that assign exponentially decreasing weights to past observations.
3. Seasonal Decomposition of Time Series (STL)
a. Decomposition Components: Breaking down time series data into its seasonal, trend, and residual components.
b. Applications of STL: Understanding how STL can be applied to various domains for trend extraction.
4. Autoregressive Integrated Moving Average (ARIMA) Modeling
a. ARIMA Components: Exploring the autoregressive, differencing, and moving average components of ARIMA models.
b. Parameter Selection: Techniques for identifying the optimal parameters for an ARIMA model.
5. Fourier Transform in Time Series Analysis
a. Frequency Domain Analysis: Introducing the concept of representing time series data in the frequency domain.
b. Periodogram and Spectral Analysis: Tools for visualizing and analyzing the frequency components of a time series.
6. Machine Learning for Time Series Prediction
a. Supervised Learning Approaches: Applying regression and classification algorithms for time series prediction.
b. Recurrent Neural Networks (RNNs): Understanding how RNNs can capture temporal dependencies in sequential data.
7. Anomaly Detection in Time Series Data
a. Statistical Methods: Utilizing statistical techniques to identify outliers and anomalies in time series.
b. Machine Learning-Based Approaches: Applying algorithms like Isolation Forest and One-Class SVM for anomaly detection.
8. Evaluating Time Series Models
a. Performance Metrics: Introducing metrics like Mean Absolute Error (MAE) and Root Mean Squared Error (RMSE) for model evaluation.
b. Cross-Validation Techniques: Ensuring that time series models are robust and generalize well to new data.
Conclusion: Empowering Insights with Time Series Analysis
Time series analysis is a powerful tool for uncovering patterns, trends, and anomalies in sequential data. By employing techniques such as trend identification, seasonal decomposition, ARIMA modeling, and machine learning, you can extract valuable insights that drive informed decision-making. Whether in finance, economics, or any field relying on time-dependent data, mastering time series analysis empowers you to harness the full potential of your temporal datasets. Elevate your analytical capabilities and unlock a wealth of knowledge hidden within the flow of danatoto time.

